How to Build a Claude Dashboard for PRs, CI and Deploys
A Claude dashboard is a web page that Claude Code builds and publishes to claude.ai. It pulls live data through a connector every time you open it.
I built one for Skyborne, my open source repo. It shows open pull requests, the CI runs on main and the latest deploys. CI, short for continuous integration, means the tests that run automatically on each push to main and each pull request. Claude also writes a short brief at the top and answers questions straight from the job logs.
This is how to build a Claude dashboard step by step, with the exact prompts I sent and everything that broke along the way. It took four prompts and about an hour and 40 minutes from my first prompt to the final version.
Here’s the short version.
- Connect GitHub to your claude.ai account as a custom connector.
- Paste a dashboard prompt into Claude Code.
- Allow GitHub when the page first opens.
- Check every number against GitHub.
- Tell Claude the look you want.
- Share it, and see what other people see.
The first wall wasn’t the dashboard. It was connecting GitHub. Anthropic’s own sample prompt says “my GitHub connector” as if one is waiting for you. There isn’t one from Anthropic that can read pull requests.
What is a Claude dashboard?
A Claude dashboard is an artifact that calls connectors each time someone opens it, using that viewer’s own connections. An artifact is a single interactive page that Claude publishes to a private link on claude.ai. A connector plugs Claude into another service through MCP (Model Context Protocol), the standard Claude uses to talk to outside tools. So the page shows live numbers, not a snapshot from the day you built it.
Claude Code got this in the week of July 13 to 17, 2026. The release notes put it plainly. “A published artifact can now call MCP connectors each time someone views it, so a dashboard shows live data and can take actions on demand rather than a snapshot from the session that built it.”
What happened to Claude live artifacts?
A lot of the “claude dashboard” guides out there are about live artifacts in Cowork. Those are gone for new builds. Anthropic’s help article on live artifacts says live artifacts are artifacts made in Cowork before August 19, 2026.
The old ones keep working, and you can still open and share them, but you can’t edit them in place. To change one, you republish it. Artifacts made on or after August 19 “work like any other artifact.”
So this post skips Cowork. Everything below runs in Claude Code, where I write all my code anyway.
What do you need before you start?
- A paid plan. The Claude Code artifacts docs list Pro, Max, Team and Enterprise for connector calls from artifacts. I’m on Max. If you’re on Pro, here’s how I’d stretch the $20 Claude plan.
- Claude Code 2.1.209 or later. Run
claude --versionto check, and sign in with/login. Sessions that use an API key can’t publish artifacts. - A GitHub connector on your claude.ai account. This is Step 1, and it’s the hard part.
One catch decides the whole setup. Only connectors on your claude.ai account work in the published page. The docs say local MCP servers in Claude Code, like the ones in .mcp.json, can feed data to Claude while it builds the page. The published page can’t call them.
I have a Netlify MCP server set up locally. The dashboard can’t use it. Not once.
What does my Claude dashboard show?
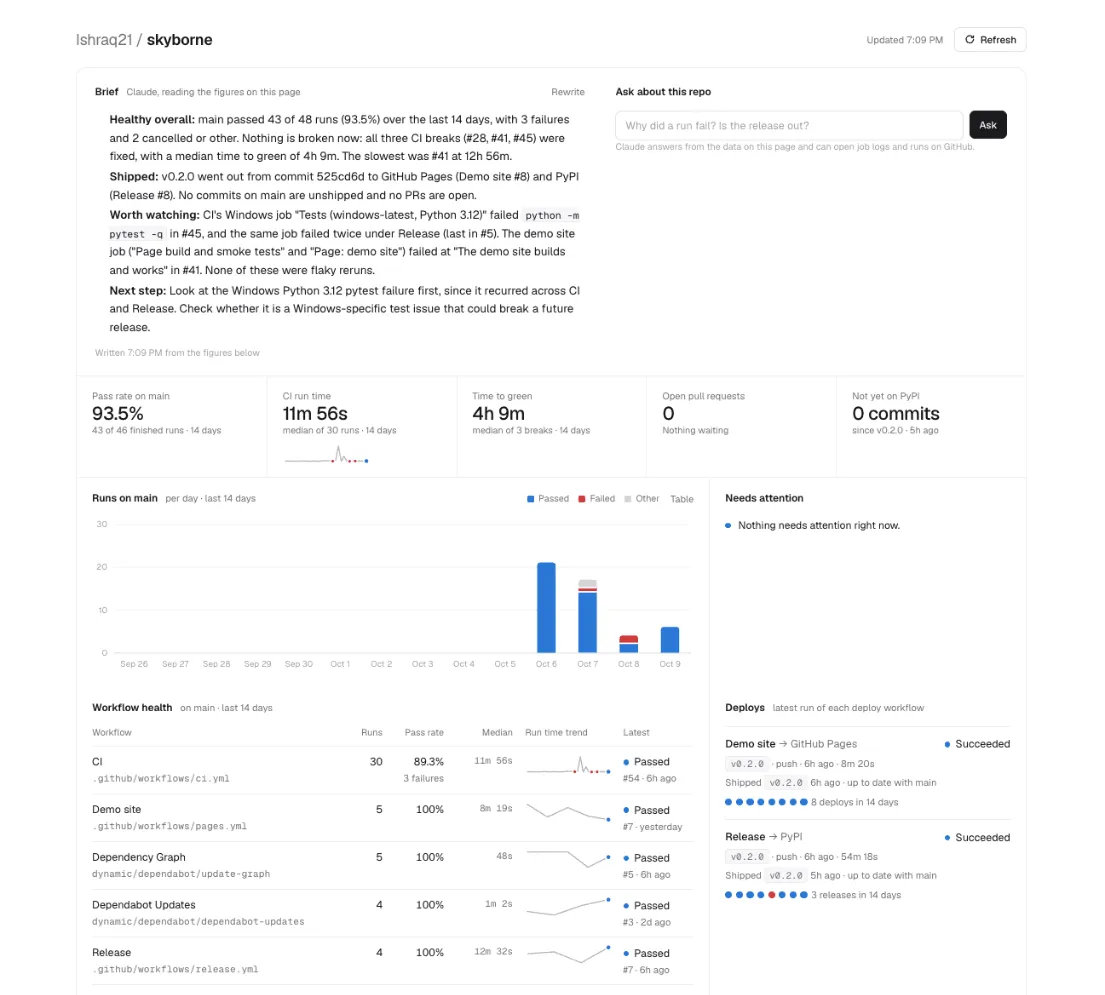
That’s my real public repo, captured on October 9. Every figure on it comes from GitHub when the page loads.
- Brief. Claude reads the figures on the page and writes a few lines on overall health, what broke and what to look at next.
- Ask about this repo. A question box with follow-ups. While it answers, Claude can open job logs, list a run’s jobs and look up other runs.
- Five headline figures. Pass rate on main, median CI time, time to green after a failure, open PRs, and commits not yet on PyPI.
- Runs on main. A 14-day bar chart of passed and failed runs.
- Needs attention, workflow health and deploys. A short list of what needs me, a table per workflow, and the latest GitHub Pages and PyPI releases. PyPI is where Python packages are published.
- Where CI breaks. Failed jobs grouped by job, with the failing step and a button to open the log.
The page’s code calculates every number from the live GitHub data. Claude only gets the finished figures to interpret. That split matters, and you’ll see why in Step 4.
Step 1. Connect GitHub on claude.ai
Three different things called GitHub come up when you try this, and only one of them works for a dashboard.
- The GitHub Integration. This is the one that shows up in your connectors list. Anthropic’s GitHub integration page says Claude “reads file names and contents only,” and it doesn’t see commit history, pull requests or issues. It’s for adding code to chats and Projects, not for feeding a dashboard.
- The Claude GitHub App. Its install page asks for read and write access to actions, checks, code, discussions, issues, pull requests, repository hooks and workflows. That’s for Claude Code working inside your repos. A dashboard only needs to read.
- GitHub’s own MCP server, added as a custom connector. This is the one you want.
I connected the wrong GitHub first. Then I nearly installed a second wrong one.
Here’s what worked, on a Max plan. It takes two parts, a token from GitHub and a custom connector on claude.ai.
Make a read-only GitHub token
A fine-grained token is one you can limit to specific repos and permissions. This one only needs to read public repos.
- On github.com, click your profile picture, then Settings.
- At the bottom of the left sidebar, click Developer settings.
- Click Personal access tokens, then Fine-grained tokens, then Generate new token.
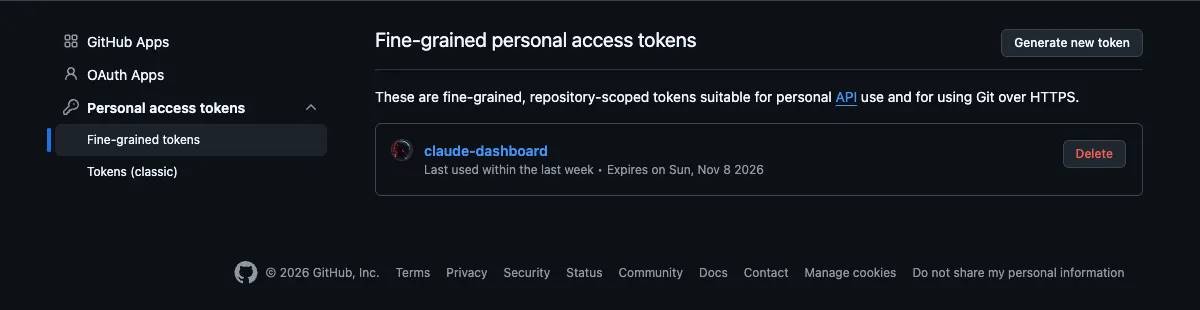
- Name it something like claude-dashboard, and set the expiration to 30 days.
- Under Repository access, choose Public repositories.
- Leave the permissions empty, click Generate token, and copy the token.
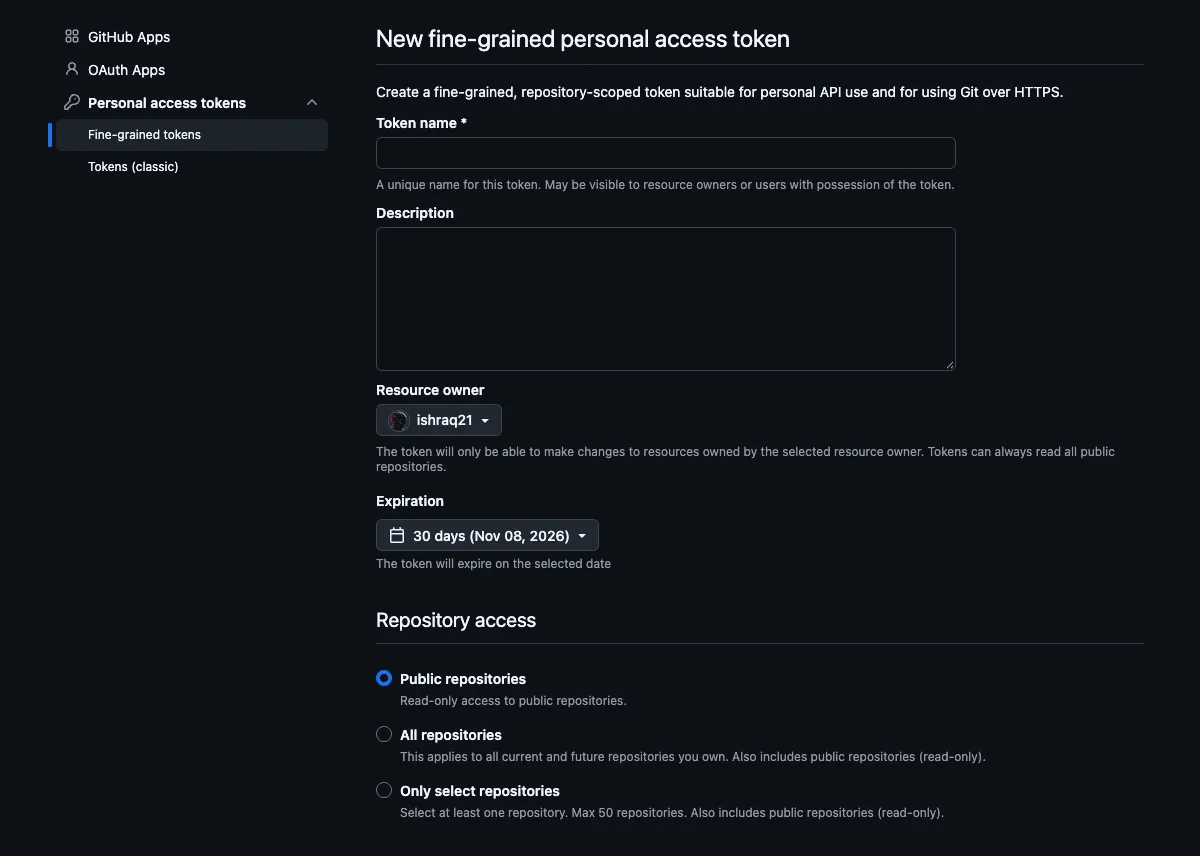
Public repositories means read-only access to public repos and nothing else. Copy it before you leave the page, and keep it somewhere safe. Don’t paste it into a chat or a commit.
Add the custom connector on claude.ai
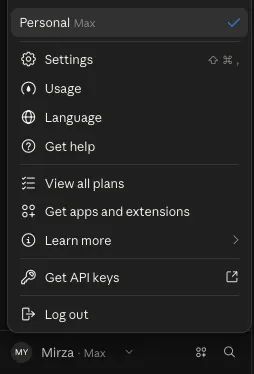
- Click your name in the bottom-left corner, then Settings.
- Under Customize in the sidebar, click Connectors.
- Click Add at the top right, then Add custom connector.
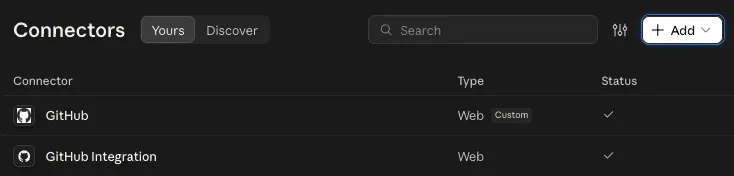
That’s my Connectors page now. The custom GitHub at the top is the one the dashboard uses. The GitHub Integration under it is the one I connected first.
- Name it GitHub, paste this server URL, and click Continue.
https://api.githubcopilot.com/mcp/x/all/readonly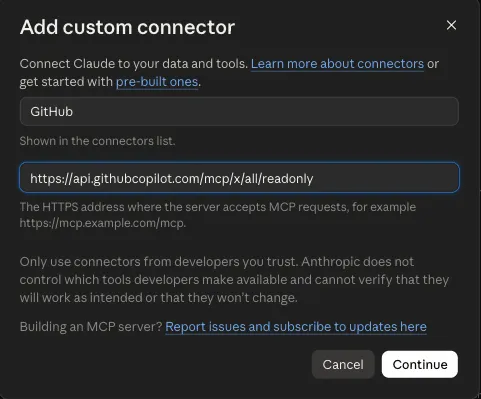
That’s GitHub’s hosted MCP server. The x/all part turns on every toolset, and the /readonly ending keeps only the tools that read.
Pick No sign-in before you touch the headers. The next screen opens with “Sign in now” and “Use your own OAuth client” already picked, both tagged Detected. That option means setting up an OAuth app, an app you register on GitHub so a service can act on your account. While a sign-in option is selected, authorization doesn’t appear in the header list.
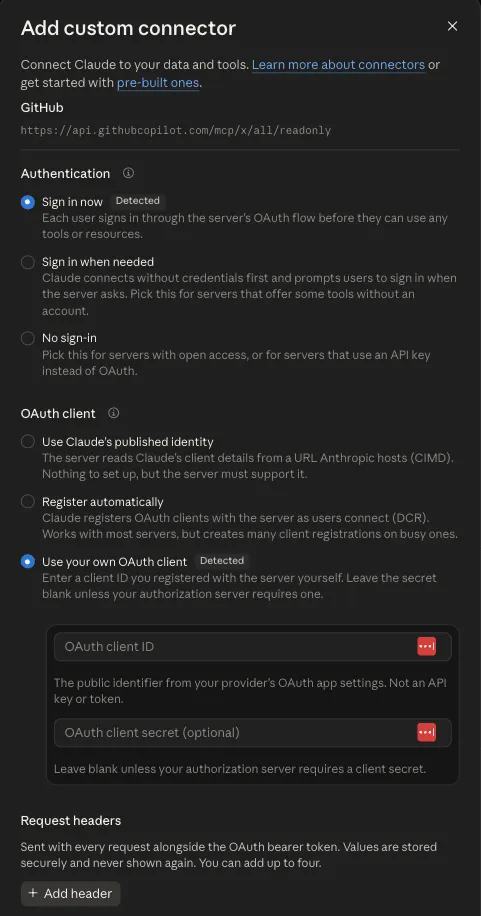
Anthropic’s custom connector docs explain why the header hides. “On an OAuth connection you can’t configure Authorization as a request header, because OAuth uses that header.”
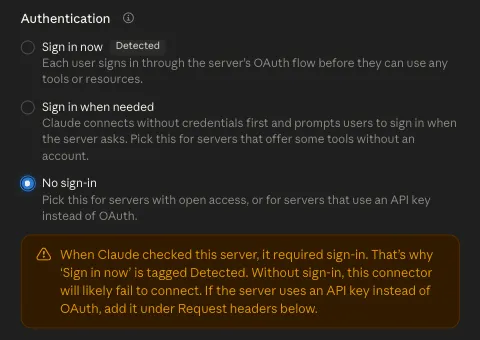
Switch Authentication to No sign-in, and the OAuth client section goes away. Then a warning says “Without sign-in, this connector will likely fail to connect.” Mine connected fine with the header.
Add the header. Click Add header, pick authorization from the list, and enter Bearer , with the space, followed by your token. The value goes out exactly as you type it, and claude.ai won’t add “Bearer” for you. You can’t edit these settings after you add the connector, so if you get it wrong, remove it and add it again.
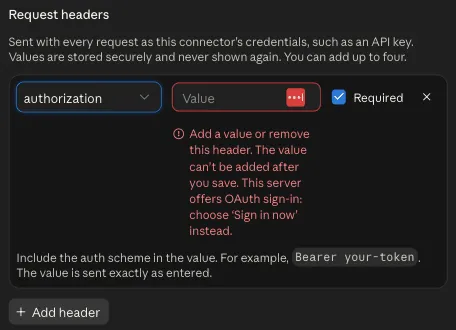
Until you fill in the value, it shows an error that ends with “choose ‘Sign in now’ instead.” Ignore it, paste your token and click Add.
The same docs say request headers are “in beta and available to a limited set of organizations.” My Max account had them. If yours doesn’t, the fallback is setting up your own GitHub OAuth app.
Once it’s added, the connector listed 62 tools, 61 of them read-only. Mine show Needs approval for every tool.
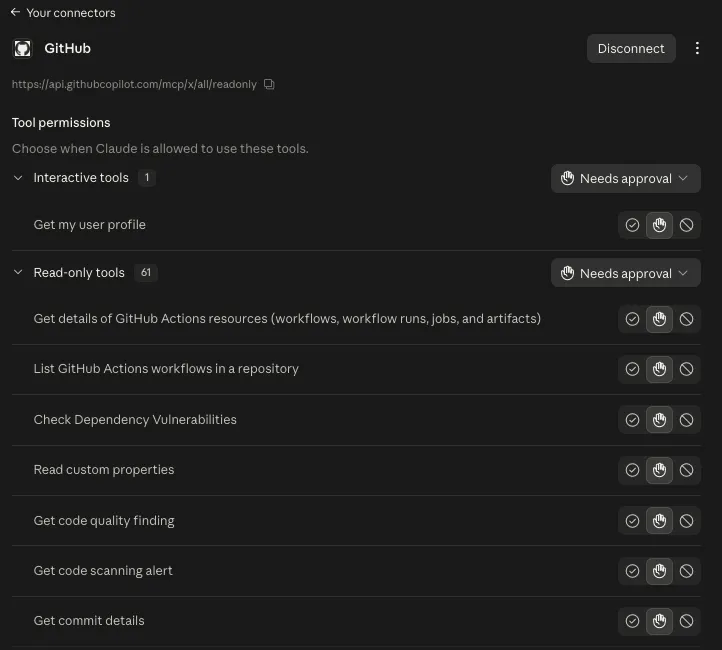
Start a new Claude Code session and run /mcp. GitHub should show up under the claude.ai connectors.
Step 2. Paste the Claude dashboard prompt
I started Claude Code in an empty folder and sent this.
Build a dashboard artifact for the GitHub repo Ishraq21/skyborne that pulls live data through my GitHub connector every time the page loads. Show open pull requests with their review state, the latest GitHub Actions runs on main with failures first, and the latest deploy from each deploy workflow with its status. Use only Ishraq21/skyborne and no other repo. Don't bake in sample or fallback data. If the connector isn't connected, show a message that names it. Add a refresh button.Three lines in it do real work. Naming one repo keeps the page from reading anything else your token can reach. “Don’t bake in sample or fallback data” keeps old numbers out of the page’s source. And the message for a missing connector gives viewers something better than an empty box.
GitHub’s MCP server doesn’t list a deployments toolset. My deploys run as GitHub Actions workflows, so Claude treated the latest run of each deploy workflow as the deploy.
Claude spent six minutes trying to open Anthropic’s own dashboard template. It gave up with “artifact not found” and wrote the page from scratch. My setup also makes Claude plan and get a second review before it builds, using my plan-reviewing subagent, which added about 20 minutes. Yours won’t do that unless you set it up.
The first version went live about 33 minutes after my prompt. Claude Code asks before it publishes a page that calls connectors, per the docs.
Step 3. Allow GitHub when the page opens
The first time I opened the page, a claude.ai modal asked me to allow GitHub. That’s by design. The artifacts docs say each call “uses the account of the person viewing the page, not the account of the person who published it.” Viewers also approve access before the first call.
So two people can open the same Claude dashboard and see different data. If a viewer hasn’t connected GitHub, or says no, the page loads without its live sections.
The Claude parts work the same way. Anthropic’s AI-powered artifacts tutorial says that when others use your shared app, “the usage is on their plan instead.” Your brief and your questions come out of your own usage. Here’s how I tracked my Claude token usage in Claude Code.
Step 4. Check every number against GitHub
The first version loaded the pull requests and nothing else. The runs and deploys sections said “GitHub’s answer for the runs on main wasn’t in the form this page expects, so nothing is shown for it.” Claude’s explanation was blunt. “It was my bug.” The connector wraps GitHub’s run list one level deeper than the page expected, so the fix checks every form the answer can arrive in.
The second bug was uglier. The Deploys table showed [object HTMLDivElement][object HTMLDivElement] instead of rows. A helper that builds the page flattened lists one level, and the deploy rows came in as a list of lists.
After that fix, Claude said “I checked the script for syntax errors after publishing, but I can’t see the rendered page from here.” It wrote the page, but it can’t look at it. You’re the QA team now.
So I checked every number on the final version against GitHub’s own data, using the gh command line tool over the same 14 days.
| Figure | Dashboard | GitHub |
|---|---|---|
| Pass rate on main | 93.5% (43 of 46 finished runs) | 43 passed of 46 finished, 48 runs in all |
| CI median run time | 11m 56s over 30 runs | 30 runs, 11m 55s |
| Median time to green | 4h 9m over 3 failures | 4h 9m |
| CI pass rate | 89.3% | 25 of 28 finished |
| Deploys in 14 days | 8 Pages deploys, 3 releases | 8 Pages runs, tags v0.1.0, v0.1.1 and v0.2.0 |
The one-second gap on CI run time is rounding. Everything the code calculated was right.
The brief was not. It said “main passed 43 of 48 runs (93.5%).” 43 of 48 is 89.6%. The 93.5% is 43 of the 46 finished runs, and the figure card right under the brief says so. The code got the number right, and Claude garbled it while describing it.
That’s why the split from earlier matters. Let code do the math, and still read what the model says about it. It’s the same reason my automated code review pipeline never lets one model grade its own work.
The “Ask about this repo” box did better. I asked “Why did CI #45 fail, and is it fixed?” Claude opened the real job log and named the failing test, test_tool_output_is_stored_truncated. It hit a TimeoutError on Windows with Python 3.12, and the test step ended with “1 failed, 352 passed and 10 skipped.”
I pulled the same log with gh run view --log-failed. It matched exactly.
Step 5. Tell Claude what you want it to look like
The first version worked, but it wasn’t the look I wanted. I wanted a minimal, white dashboard, so I said exactly that. The redesign came back with a white background and one typeface. Monospace shows up only for run numbers and commit IDs, and each status is a small colored dot, with red text only for failures.
The docs say Claude applies a built-in design skill to every artifact. It’s good. It just has its own taste, which might not be yours.
You can steer it two ways. Name the look in your prompt, or put your colors, fonts and spacing in your project’s CLAUDE.md. The artifacts docs say Claude treats your design system as more important than its own choices, and your prompt as more important than both.
Then I wanted a real dashboard instead of one long list. Here’s an example of how to ask for one, based on what ended up on mine.
Turn this into a real dashboard instead of one long list. Add a short brief at the top that Claude writes from the numbers, and an "Ask about this repo" box for follow-up questions. Below that, show five headline figures for the last 14 days: pass rate on main, median CI run time, time to green after a failure, open pull requests, and commits not yet released. Then add a 14-day chart of runs on main, a Needs attention list, a workflow health table, the latest deploys, and a table of where CI breaks. Keep calculating every number in code, and give Claude only the finished figures.Mine got all of that, plus two more read-only GitHub tools, for commits and job logs.
Step 6. Share it and see what others see
Click Share in the page header. On Max, choosing “Anyone with the link” brings up this.
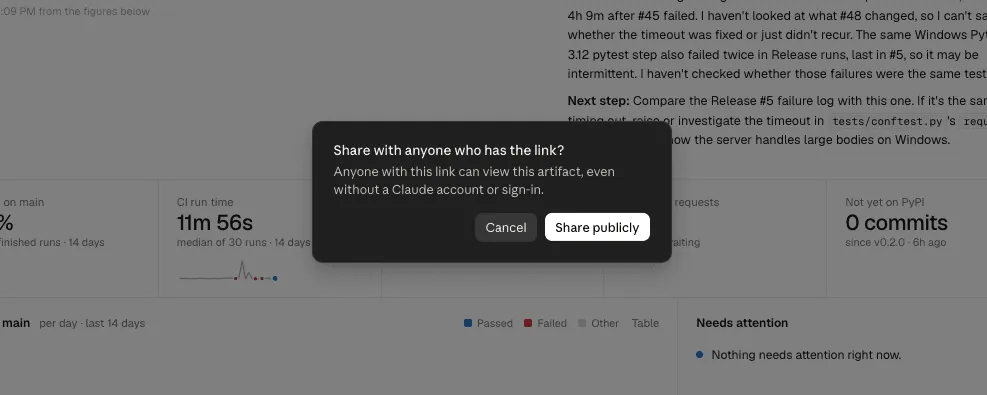
Anthropic’s share artifacts article says “Artifacts that connect to your apps or use Claude can’t use ‘Anyone with the link.’” The Share button disagrees.
The Claude Code docs explain what that link really gives people. Connector calls don’t run for anyone who opens a public link without signing in to claude.ai. They see the page without its live sections.
For a GitHub dashboard, that means a stranger would see the page without any of the GitHub data. Within a Team or Enterprise organization, each signed-in viewer sees data through their own GitHub connector. So a shared Claude dashboard only works for people who have set up the same connector.
Does a Claude dashboard update by itself?
Yes, when you open it. The docs say the page fetches data when it loads, and can also refresh on an interval or from a refresh button on the page. Responses are cached in your browser, so a page you reopen shows the cached data first and then updates.
Mine fetches on load and has a Refresh button. It doesn’t poll in the background.
Would I use a Claude dashboard every day?
Maybe not. I’d rather use GitHub itself. I’m comfortable with the gh command line tool and GitHub’s own pages, and for CI it’s GitHub Actions all day.
I wanted to explore the feature. And don’t get me wrong. For a lot of people, having everything in one place is very insightful.
You might know my 3D sky city for Claude Code sessions. That one was just for fun. I wanted to see what I could create with Three.js, Python and Opus 5.5. This time I wanted to see something useful.
Would you keep a Claude dashboard open all day, or is it GitHub Actions all day for you too?